The report season is driving the market


The report season has started. Last week, 23 companies in the S&P 500 index reported their Q4 results (or correspondingly). Thus, the total number of companies that have reported is now up to 44. It was the banking and finance sector that dominated last week with six major banks and investment banks reporting.
The report season has started. Last week, 23 companies in the S&P 500 index reported their Q4 results (or correspondingly). Thus, the total number of companies that have reported is now up to 44. It was the banking and finance sector that dominated last week with six major banks and investment banks reporting. Overall, 70 per cent of the companies have topped expectations on the profit side so far, where Banking and Finance is at 63 per cent and Industrial is at a 56 per cent. Notably, two out of three companies in the industrial segment have delivered weaker revenue than expected. Industry, together with technology, is the most cyclical sectors.

A summary of last week's reports is shown below:

Historically a setback often comes just before or in the beginning of the reporting season, but this has not been the case so far. Also, stocks tend to move upwards as the reporting season has been going on for a couple of weeks. It still remains to be seen how it turns out this time.
In any case, the reporting season in the US has so far had a strong start. In addition, last week the Fed also resumed buying government backed securities in the market, giving the continued a boost to stock valuation:

For two days in a row the intraday move has been looking pretty much the same: S&P 500 gapped up, trading continued during the day in a sideways move to finish off the trading day with a push upwards. In other words, it looks like the computers are executing a large client order right now. The trend is still rising and is moving into levels where the air is thin:

Below is the daily graph for S&P 500. As can be seen, the index is trading well above the rising EMA9 as well as MA20 acting as support on the downside.

RSI is at overbought levels. This is not a sell-signal on its own. Thus, the RSI can be overbought for some time to come. The Fed and the report season are likely to drive the market, up or down.
The tech heavy Nasdaq 100 is moving straight upwards:

As for S&P 500, the RSI-indicator is at overbought levels. The upwards sloping EMA9 and MA20 function as support on the downside.
Bull & Bear Certificates
However, one should never forget the large economy in the east, China. All macro data indicate that Chinese economy should slow down quite significantly. On Friday, the Chinese GDP figure came in at a growth rate corresponding to 6.1 percent, which also is a considerable slowdown. The slowdown would probably have been even more clear if the Chinese authorities had chosen to show the correct figures. However, the market is aware of that the numbers from China usually are fishy/manipulated to a certain extent.
Below shows the GDP-growth for the Chinese economy. As can be seen, China's GDP growth has been on a sloping curve since 2007. Note, however, that it is one of the world's largest countries and with figures that put almost all other countries on the sideline:

China’s Shanghai Stock Exchange Index (SSEC) has also been lagging other large western stock indices the last few days. Shanghai is a well-studied retail market that is governed by speculative trading, which can provide fast and unmotivated price swings. From time to time funds operated by the government step in and drive the market in a specific direction and it does not always have to be upwards.
The question is whether the recent price hike in SSEC has taken place to create a better trade negotiating position for the country with Donald Trump? And now that Phase 1 of the trade agreement has been signed, the share prices fall again:

This is a development that should be kept under close watch as SSEC has a tendency to guide other stock exchanges with 6-12 months of legislation. Also not how closely connected Shanghai is with Sweden’s OMXS30:

OMXS30 shown in the graph below has been consolidating and thus lagging S&P 500. On Friday the index did however manage to break away. MACD has generated a weak buy signal and EMA9 is once again upwards sloping:
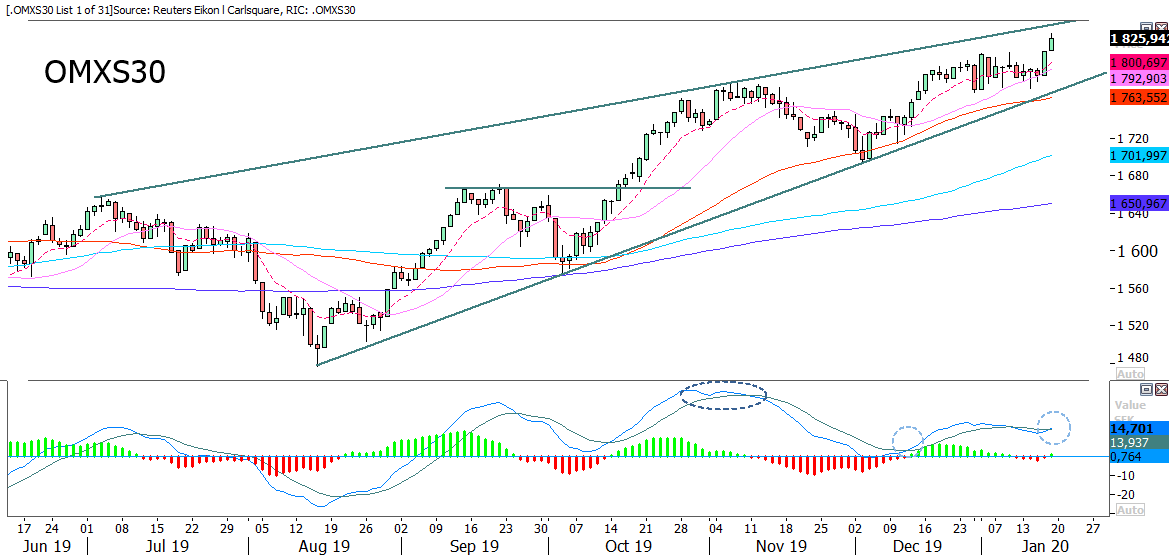
A resistance level is close in sight, but company reports is likely to drive the market. Among the OMXS30-companies, Sandvik and Ericsson will release their reports this week.
The German DAX index has also lagged S&P 500. Even though the strong ending of the week, the index did not manage to break above its previous high from early January. See graph below:

The shorter trend is nevertheless upwards sloping and report season is likely to drive the German market as well.
Bull & Bear Certificates
Time for Boliden to test previous top
Swedish Boliden will release its Q4 first on February 13. The share broke above Fib 23.6 on Friday with an attempt to test the SEK 265.5-level but without success:

EMA9 has turned upwards sloping and MACD has generated a buy signal. In case of a break above this level the upside to the SEK 287.5-level is appealing. On the downside, Fib 23.6 at SEK 258 serves as support.
Bull & Bear Certificates
Further upside in Swedbank
The Swedbank share managed to close above Fib 61.8 as well as falling MA200 on Friday. As can be seen in the graph below, some upside still exists in the share:

The resistance level is made more visible in the weekly graph below:

Additional worth noticing from the weekly graph is the positive divergence between the share price and MACD.
Bull & Bear Certificates
Scary formation in EUR/USD
A scary bearish head-and-sholder formation can be found in the EUR/USD. A break below the neckline at 1.1 calls for furth downside:

Support can be found at the 1.1-level.
Bull & Bear Certificates
Oil is under pressure
The WTI-oil is under pressure and a strong USD does not help. As can be seen in graph below the WTI-oil is trading below its falling EMA9 as well as MA20:

The floor of the rising trend makes up a support level that so far has stood strong. Its upside looks appealing in case of a break above EMA9 and MA50.
Bull & Bear Certificates
Risks
This information is in the sole responsibility of the guest author and does not necessarily represent the opinion of Bank Vontobel Europe AG or any other company of the Vontobel Group. The further development of the index or a company as well as its share price depends on a large number of company-, group- and sector-specific as well as economic factors. When forming his investment decision, each investor must take into account the risk of price losses. Please note that investing in these products will not generate ongoing income.
The products are not capital protected, in the worst case a total loss of the invested capital is possible. In the event of insolvency of the issuer and the guarantor, the investor bears the risk of a total loss of his investment. In any case, investors should note that past performance and / or analysts' opinions are no adequate indicator of future performance. The performance of the underlyings depends on a variety of economic, entrepreneurial and political factors that should be taken into account in the formation of a market expectation.