Dr Copper is under the weather


Copper is considered a bellwether of economic activity, because of its widespread application in everything from home building to electronics. Hence the nickname “Dr Copper.” Given increasing concerns of, e.g., a US recession ahead, the copper price will be an important indicator to watch.
Copper is considered a bellwether of economic activity, because of its widespread application in everything from home building to electronics. Hence the nickname “Dr Copper.” Given increasing concerns of, e.g., a US recession ahead, the copper price will be an important indicator to watch.
The copper price is down some nine per cent in 2022 but still has about doubled since the covid lows of 2020. In 2021, the price was fuelled by shortages and historically low copper inventories. Many pundits have a long-term bullish view as copper is a strategic resource in the electrification of economies and transportation. However, rate hikes and quantitative tightening in the US, a higher USD, as well as a risk for lower economic activity, are causing short-term headwinds for the commodity.
From a technical perspective, copper is in a negative trend below moving average MA 200 and is at risk of breaking down from a twelve-month consolidation and support level. There could be further volatility ahead.
Copper (in USD), daily 12-month price chart
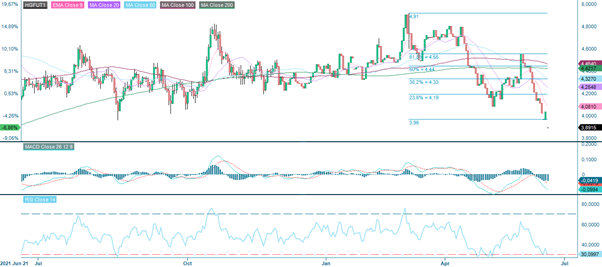
A decisive break
down below levels of USD 4 per pound would spell bad news, with weekly Fibonacci
Fib 50 retracement at USD 3.45 as a possible target. A possible silver lining could
be the easing of the China lockdowns. Also, the price looks oversold with a
possibility of a bounce back into the consolidation range (up to about USD 4.2,
representing a Fib 23.6 retracement).
Copper
price (in USD), June 2017 to June 2022

The full name for abbreviations used in the
previous text:
EMA 9: 9-day exponential moving average
Fibonacci: There are several Fibonacci lines
used in technical analysis. Fibonacci numbers are a sequence of numbers in
which each successive number is the sum of the two previous numbers.
MA20: 20-day moving average
MA50: 50-day moving average
MA100: 100-day moving average
MA200: 200-day moving average
MACD: Moving average convergence divergence
Risks
This information is neither an investment advice nor an investment or investment strategy recommendation, but advertisement. The complete information on the trading products (securities) mentioned herein, in particular the structure and risks associated with an investment, are described in the base prospectus, together with any supplements, as well as the final terms. The base prospectus and final terms constitute the solely binding sales documents for the securities and are available under the product links. It is recommended that potential investors read these documents before making any investment decision. The documents and the key information document are published on the website of the issuer, Vontobel Financial Products GmbH, Bockenheimer Landstrasse 24, 60323 Frankfurt am Main, Germany, on prospectus.vontobel.com and are available from the issuer free of charge. The approval of the prospectus should not be understood as an endorsement of the securities. The securities are products that are not simple and may be difficult to understand. This information includes or relates to figures of past performance. Past performance is not a reliable indicator of future result.