Does Bitcoin indicate an impending crash?


Bitcoin has risen in price very sharply recently, see weekly graph below. There are many comments in the Bitcoin world that people are fleeing from common asset classes to the more secure Bitcoin. The cryptocurrency has strong features of ideology behind it, which makes it extra difficult to analyze this type of asset. But is a rapidly rising price of bitcoin a warning sign in the sky?
Bitcoin has risen in price very sharply recently, see weekly graph below. There are many comments in the Bitcoin world that people are fleeing from common asset classes to the more secure Bitcoin. The cryptocurrency has strong features of ideology behind it, which makes it extra difficult to analyze this type of asset. But is a rapidly rising price of bitcoin a warning sign in the sky?

If you read the articles about the price increase in Bitcoin, the driving force is an escape from the usual currencies that are quickly devalued when central banks and states pump out support in society.
However, news media have not yet been dragged into the same upswing as in 2017 when Bitcoin was last at these high levels. See graph below. If you see that this graph continues to rise, you can expect a continued increase in the price of Bitcoin.

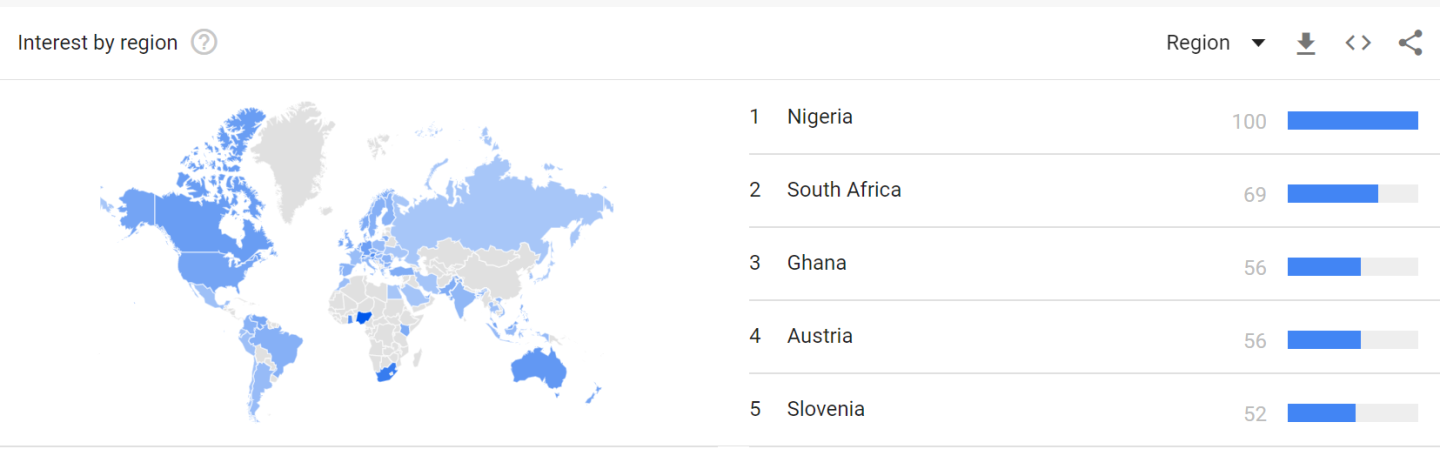
Interest in Bitcoin has a spread globally where troubled parts of the world end up high on the lists, such as some African countries. Bitcoin is linked to areas that are often characterized by unrest. Places where you need to move currencies out of control of the government or an enemy.
The news agency Bloomberg has been monitoring Bitcoin regularly for some time. They do this with a disclaimer that is included in virtually all articles. Namely that they regularly write that the amount of outstanding Bitcoin is concentrated on very few hands.
They refer to data from Flipside Crypto, a consulting firm in the Blockchain industry that helps others to succeed in their projects.

In any case, the picture above shows the concentration of Bitcoin measured by the number of accounts. In other words, it shows that 95 percent of all Bitcoin is concentrated in just two percent of all accounts. If this is true, it is a clear warning flag that Bitcoin is extremely easy to manipulate. The market is as controlled as the diamond market has historically been dominated by De Beers.

Bitcoin (in blue) is rising rapidly against the USD (in red). This can be seen in the graph above where Bitcoin is rising sharply now that the USD is falling.

But if you start studying this more closely, you will probably still find that what Bitcoin is doing right now is a catch up against other asset classes. In the graph above, we have plotted Bitcoin against the EUR/USD.
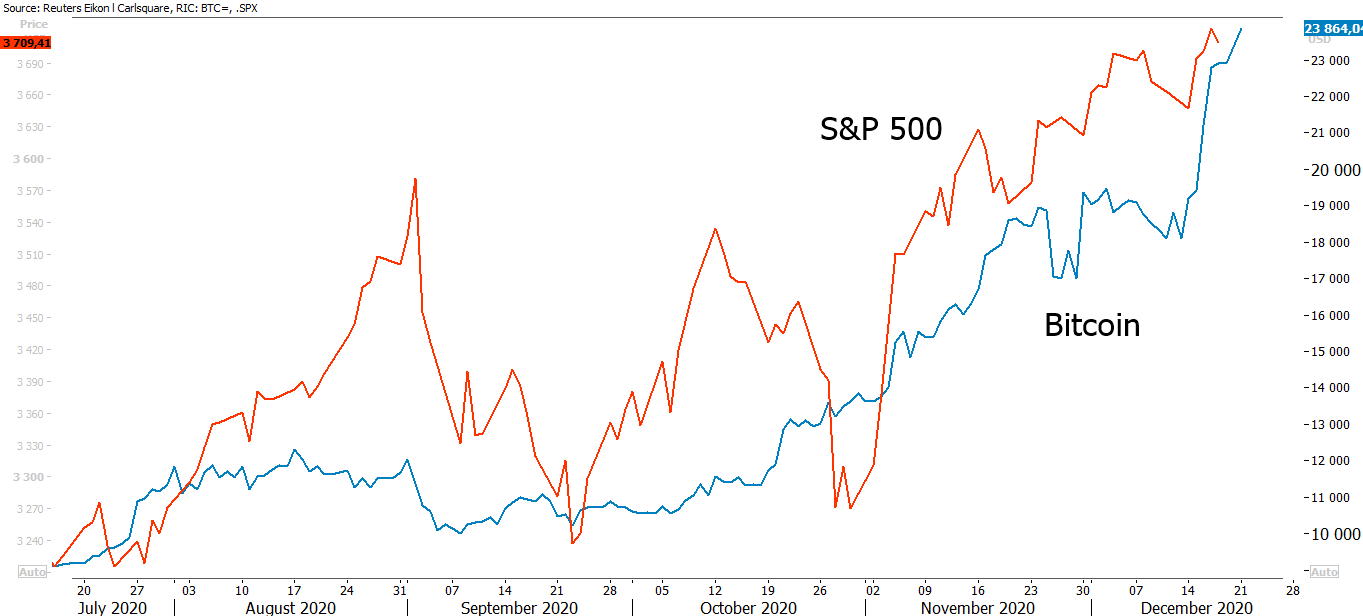
The graph above shows Bitcoin against the S&P500 index. The same conclusion can be drawn from this: Bitcoin is undergoing a recovery phase.

The big discrepancy is that the rise in the price of Bitcoin has crushed the equivalent in Gold recently. But is all the concern exaggerated? No, it is absolutely not.

The central banks will continue to pump out money. According to the latest Fed meeting, this will continue at a steady pace until the labor market in the United States recovers. An increasingly amount of money is putting upward pressure on inflation. In any case, according to all schoolbooks, which the mainstream takes notice of.
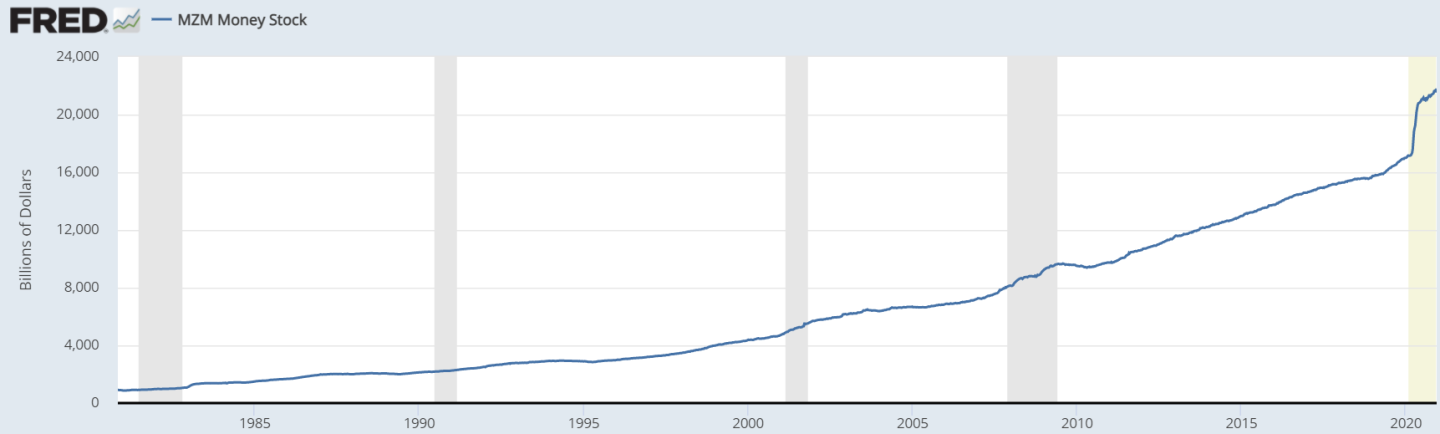
The measures of the money supply are blunt. Above is MZM which replaced M3. It shows all available funds in a state that are considered liquid, such as all banknotes and coins as well as money market assets. Even though in our eyes it is far too narrow a measure, you can see the strong expansion that is currently taking place.
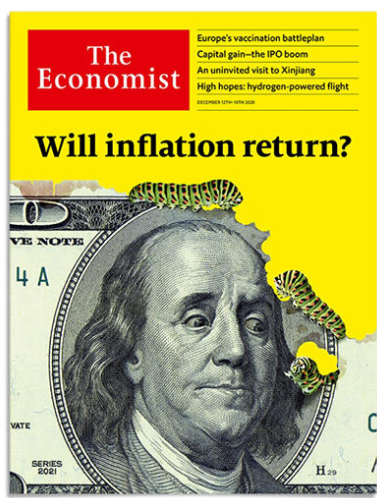
When business magazines have a front-page theme, it is a sign of the times. It is also a sign that the trend has gone very far because journalists are typically late in the trends. (If you are too early in the trend, you will not get any readers, i.e., no clicks).
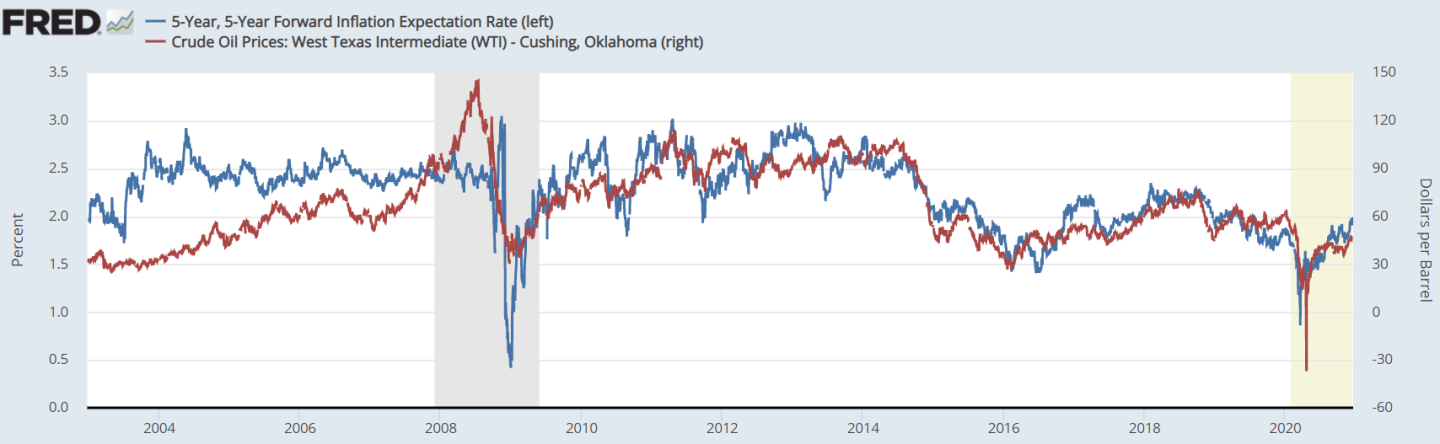
The graph above shows US inflation expectations in blue. Note that they were in a steep fall right up until the Covid 19 crisis. Since then, they have risen while central banks have promised new support. The red line shows the oil price. The correlation is astonishingly high. (We will come back with an explanation soon).

What is puzzling, however, is the graph above. It shows an expected inflation in blue, which is thus around 2 percent. But the red line shows the outcome of inflation. This line is between 0-0.3 percent in actual outcome. This measure of inflation does not measure inflation in asset classes but inflation in prices that consumers spend in, especially in stores.
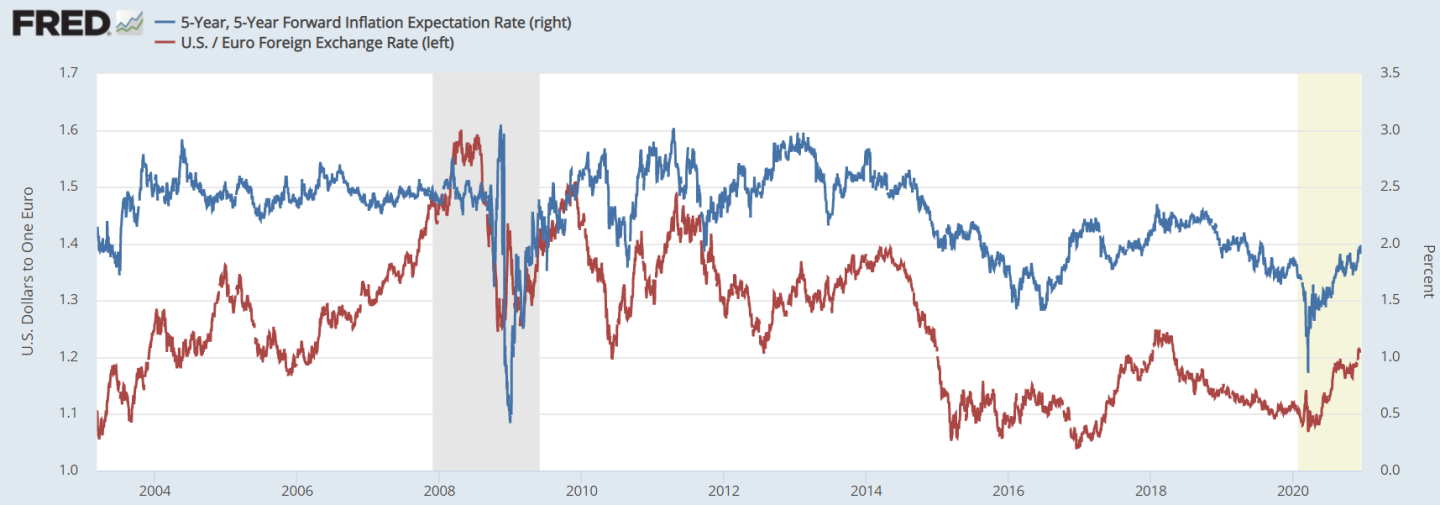
What governs inflation expectations instead seems to be exchanges rates. Above you can see how the EUR/USD rises and falls in the same periods as inflation expectations. So, we come back to our old thesis:
- A rising USD gives a falling stock market
- A falling USD gives a rising stock market
The US Dollar-index is in a steady falling trend in the daily chart after breaking a support at 92 in the dollar index:

Below is the monthly chart for the US Dollar-index since Q4 2017. The first strong support comes around 88. But note how the basket is trading below the rising trendline and that momentum is in a falling trend.

So, all in all, this gives a continued bright picture for the stock markets. This even though valuations are beginning to become uncomfortably high, as in the year 2000. Inflation created by central banks is not reflected in consumer prices. The clearest sign is instead that new money hold back the number of bankruptcies with cheaper credits and that the stock markets are rising.
Euro holds the biggest weight in the US Dollar Index. As shown in the graph below, the currency pair is trading in a nice upwards sloping trend, above rising EMA9 and MA20. Let the trend be your friend – and buy the dips?

Anyway, if you actively participate in the stock market rise, it is important to always keep track of where the nearest emergency exit is.

In the daily graph, the S&P500 index rise in the trend channel with the support from EMA9 and MA20:

The 60-minute graph shows a bearish rising wedge-formation. A break on the downside calls for a test of the floor of the short rising trend-channel in the daily graph:

Tech-heavy Nasdaq index is also trading above EMA9 and MA20 but in a bearish rising wedge in its daily graph below. A break on the downside and the formation calls for MA200 around 12 000 to be tested:

The Amazon stock fell last Friday. The graph only shows a standard retest of previous resistance, which has now become a support. This creates the optimal entrance to a trade. On the other hand, the last three days show a warning in the form of an Evening Star formation, which thus shows the way for a continued decline. Keep an eye on the 3 145-level:

The DAX index has broken over the old gap but now two ugly dojis have been created. The latest one is called a Gravestone doji and is just as cheerful as it called. If EMA9 hold, you do not need to throw in the towel. But two dojis in a row shows that the market is worried about developments in Europe. Note, however, that the outbreak over the old gap now constitutes a support.

The OMXS30 index is still under pressure and closed Friday’s trading just above the 1 880-level. Note how MACD is falling. The question is if the 1 880-level can hold:

The H&M stock closed Friday below Fibonacci 23.6 which opens up for the 170 SEK-level to be tested:

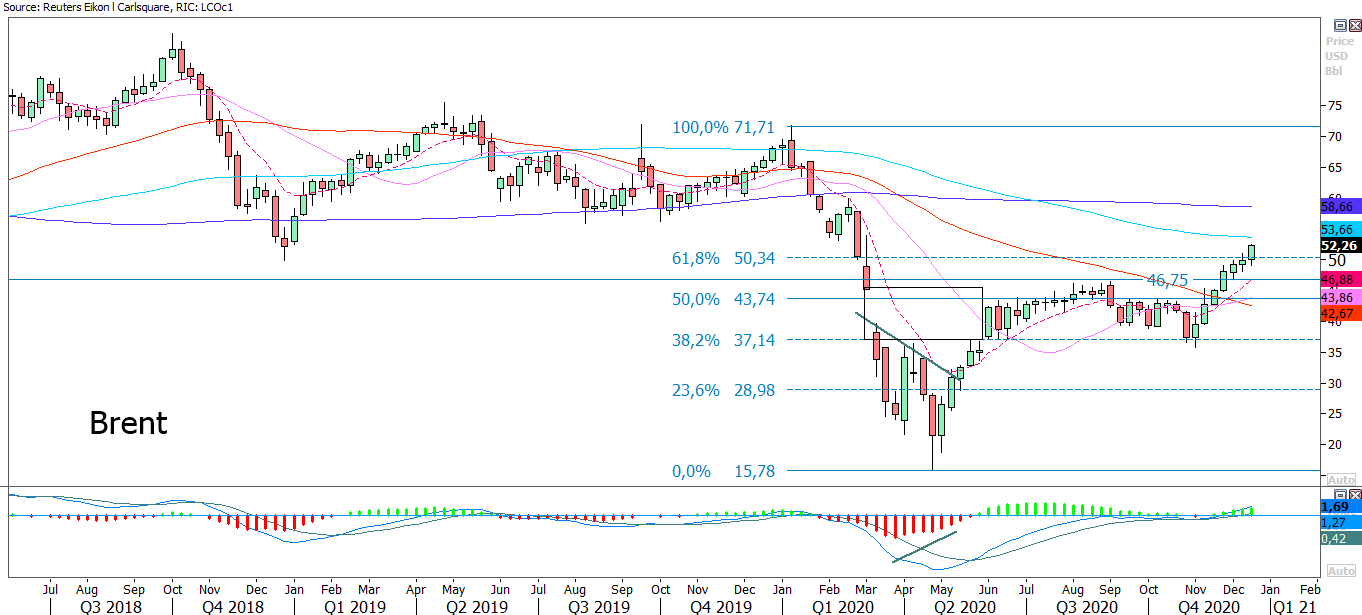
Brent oil is on fire and is fueled by the weaker USD. Last Friday the oil price closed above Fibonacci 61.8 in the weekly chart below. MA100 around 53,7 USD/barrel is next. In case of a break on the upside the next level can be found around 58,7 USD/barrel where MA200 meet up:
We are now taking a break and wish all our readers a Merry Christmas and a Happy New Year!
Risks
This information is in the sole responsibility of the guest author and does not necessarily represent the opinion of Bank Vontobel Europe AG or any other company of the Vontobel Group. The further development of the index or a company as well as its share price depends on a large number of company-, group- and sector-specific as well as economic factors. When forming his investment decision, each investor must take into account the risk of price losses. Please note that investing in these products will not generate ongoing income.
The products are not capital protected, in the worst case a total loss of the invested capital is possible. In the event of insolvency of the issuer and the guarantor, the investor bears the risk of a total loss of his investment. In any case, investors should note that past performance and / or analysts' opinions are no adequate indicator of future performance. The performance of the underlyings depends on a variety of economic, entrepreneurial and political factors that should be taken into account in the formation of a market expectation.