DAX Market Analysis, October 2020

September saw DAX making the awaited correction downwards and our expected 12350 support level was almost unusually accurate. DAX ended September with -1.5% down, almost exactly the historical monthly average.
September saw DAX making the awaited correction downwards and our expected 12350 support level was almost unusually accurate. DAX ended September with -1.5% down, almost exactly the historical monthly average.
On monthly charts, September became a fairly directionless consolidation month where DAX tested levels clearly above and clearly below monthly open and close levels, leaving long wicks in the monthly candle. Range for the month was ca 8.4% while close vs open was -1.5% so there was plenty of volatility for short term trading.
On the high side, 13300 was a strong level of resistance again - we have now seen DAX bouncing back down several times from there. This will be most likely a key level to follow if DAX resumes trend upwards and tries to break up. Similarly, daily MA200 (now at 12250) has given support already more than once. Big trend for DAX is still up, i.e. it is more likely that after the correction we will see the index going up to test 13300 - however approaching US Presidential election is likely to increase volatility and nervousness at least in intraday trading.
As mentioned, in the big picture September became a month of consolidation after a strong move up. As long term trend is bullish, the most likely direction seems upwards.

Long term supports on monthly chart: 11300, 12060, 12350
Long term resistance on monthly chart: 13500, 13800, 14000
Below DAX weekly chart with monthly pivot points visible. Pullback took place on 3rd week of September, and that weekly candle closed with a wick below, indicating that buying pressure was returning. This was even more evident with S&P500 index so many traders were taking long/call positions after this week, and were quite successful with their trades. If DAX continues upwards, monthly pivot R1 is at the same level as previous high so this quite likely is the first clear test for the index to clear. Similarly below, EMA12 (12700) and S1 pivot (near previous lows of cs 12250) act as likely levels of support. Below them there would be technically speaking then more space for DAX to drop.

Medium term resistance levels: 13380, 13700
Medium term support levels: 12250, 12700
For a long position, situation after the pullback is fairly simple in technical terms - once the pullback is over, it is matter of finding a good entry e.g from a intraday dip. For a long trade, also a stop can be quite tight, e.g. around 12700.
For a short position, level 13380 is most likely significant as if DAX crosses above it, it is quite likely that trend upwards continues so it can be also used as an exit point for a short trade.

Above: Investors’ sentiment in USA is largely unchanged.

After historically weak August and September, October has been on average a strong month for DAX.

Above: Split of shares in DAX index below and above their respective DMA20 values. Market pullback in September is visible also here and lows were at the same level as last time before DAX turned back up.
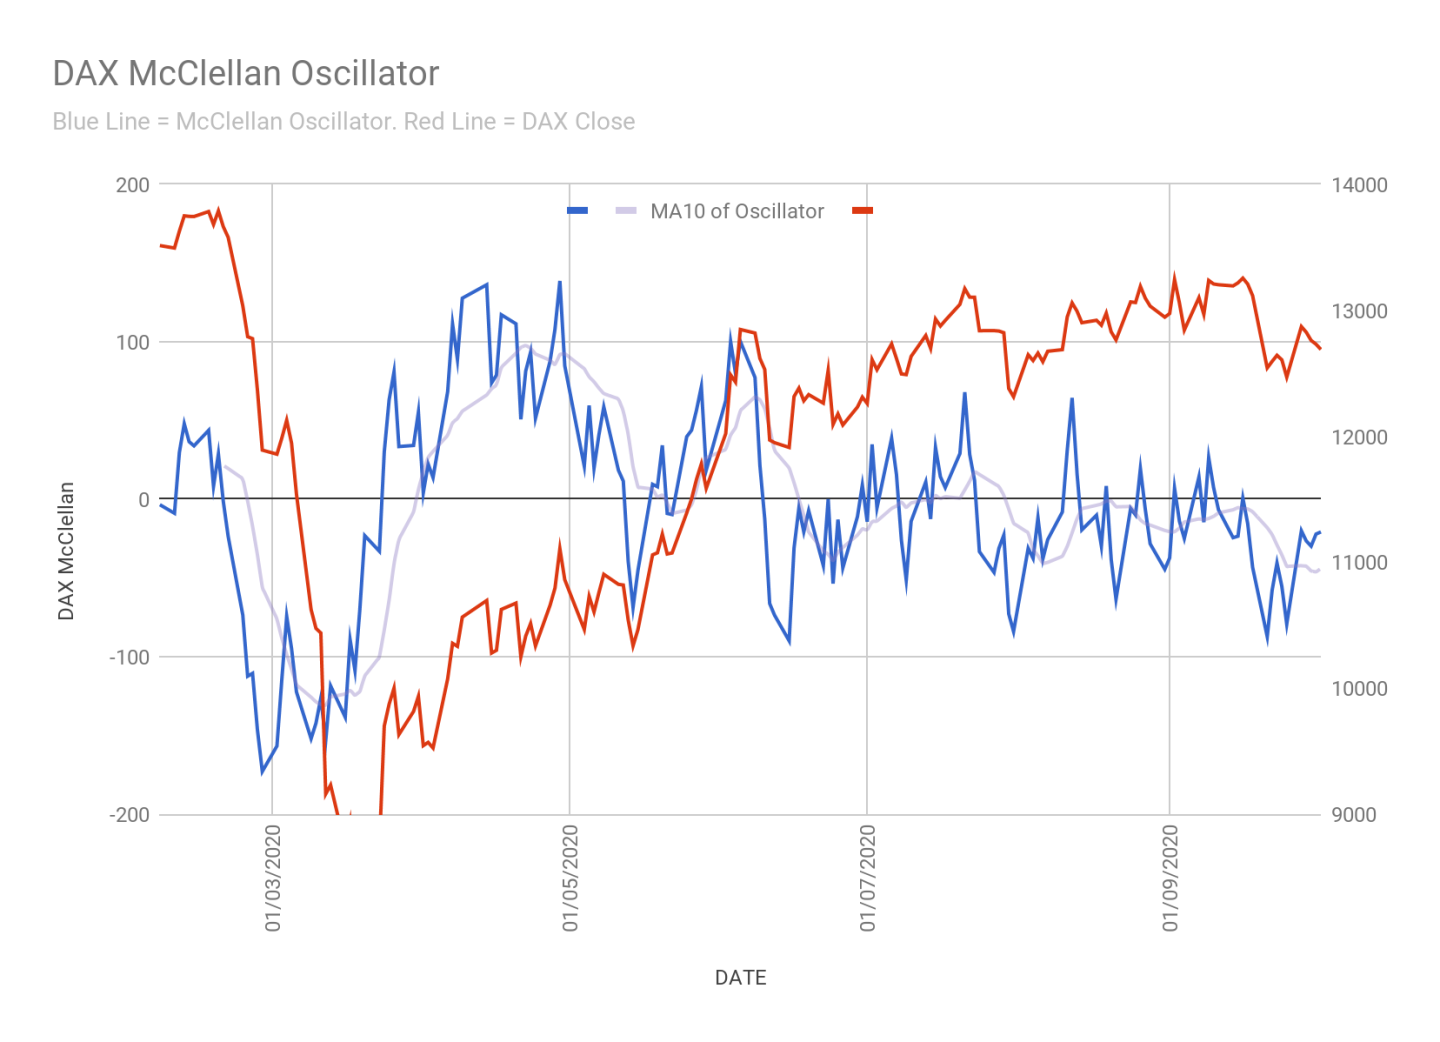
Above: McClellan oscillator is near market neutral.
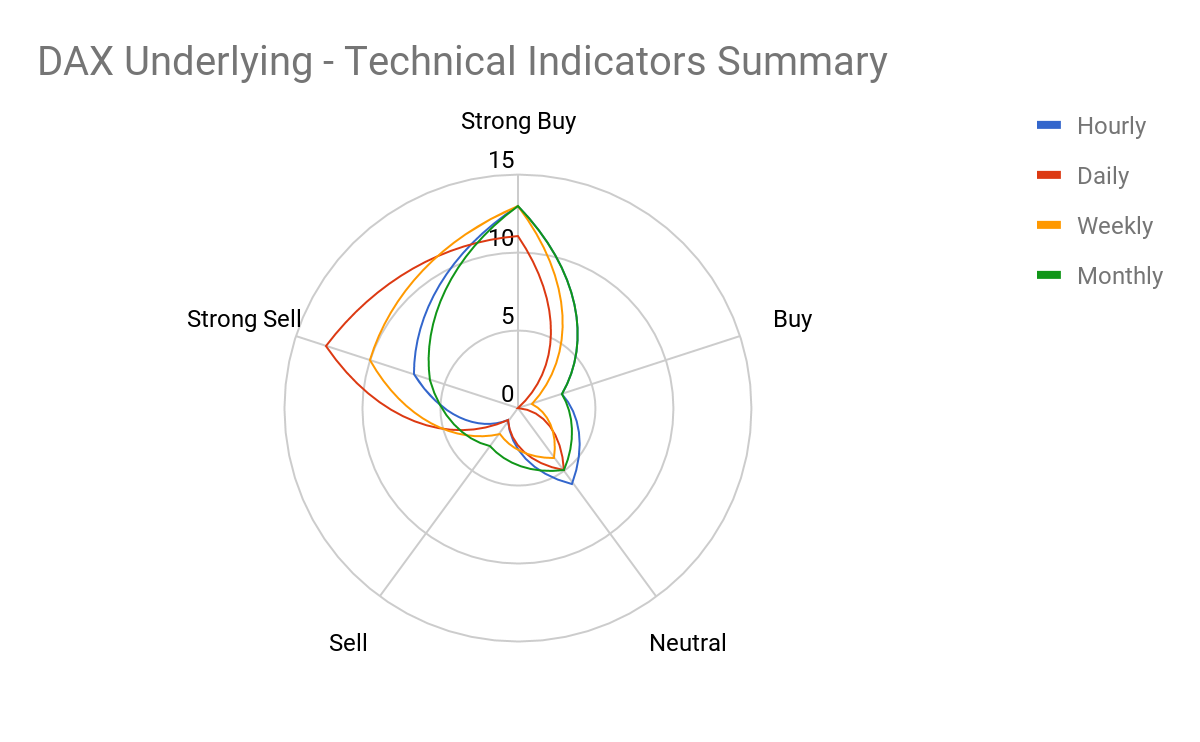
Above: Summary of technical indicators for DAX is unclear again, split between strong buy and strong sell.


Above: Historical average weekly and daily changes for DAX.

Above: DAX volatility has been clearly decreasing, except for the pullback week in Sep. This is a bullish indicator.

World’s main futures: also here the picture is technically unclear.
Risks
This information is in the sole responsibility of the guest author and does not necessarily represent the opinion of Bank Vontobel Europe AG or any other company of the Vontobel Group. The further development of the index or a company as well as its share price depends on a large number of company-, group- and sector-specific as well as economic factors. When forming his investment decision, each investor must take into account the risk of price losses. Please note that investing in these products will not generate ongoing income.
The products are not capital protected, in the worst case a total loss of the invested capital is possible. In the event of insolvency of the issuer and the guarantor, the investor bears the risk of a total loss of his investment. In any case, investors should note that past performance and / or analysts' opinions are no adequate indicator of future performance. The performance of the underlyings depends on a variety of economic, entrepreneurial and political factors that should be taken into account in the formation of a market expectation.