DAX Market Analysis, April 2021

March was wild for DAX – the index gained ca 9% and pushed through both levels 14000 and 15000 ! As a result, delta to monthly EMA12 average is already ca +12.5% which starts to approach max delta for DAX, historically speaking.
March was wild for DAX – the index gained ca 9% and pushed through both levels 14000 and 15000 ! As a result, delta to monthly EMA12 average is already ca +12.5% which starts to approach max delta for DAX, historically speaking. In early 2015 we saw ca 14% positive deviation to EMA12 and this has been the highest level since. So likelihood for correction seems significant - it might not happen during next weeks but historically speaking, it is quite possible over next 2-3 months.
Bull & Bear Certificates
April has been historically the strongest month for DAX, so it is very possible that index tests yearly R1 pivot at 15622. Above this level, it is hard to define many points of resistance through technical analysis (or any other analysis probably). In addition to yearly R1 pivot, level 16000 is psychologically a significant one. But as mentioned, positive delta to longer term averages is significant so even though April has been strong, an extra level of caution is in order when looking at next 2 months ahead.

Long term levels of support: 13450, 14100
Long term levels of resistance: 15000, 15600
Weekly chart below with monthly pivot levels shown. Every week in March was a positive one, market was extremely strong. EMA6 and EMA12 lines, shown on the chart, have been systematically providing support for DAX so they are good to keep in mind - EMA6 is currently 14580 and EMA12 14250.
As mentioned, April has been usually very strong for DAX so monthly R1 pivot at 15410 is quite possible. But at the same time, pressure for downwards correction is also very high.

Medium term levels of resistance: 15410, 15800
Medium term levels of support: 14250, 14600
For a Long position, the challenge is to find a good entry in terms of risk/reward. EMA6 and EMA12 from weekly chart are likely to be one of the best ones for longer swings, e.g. BULL DAX X3 VNT2. Another option is to look for pullbacks in intraday.
Bull & Bear Certificates
For a short view, the situation is very challenging as the uptrend has been very strong and April is historically very strong. Monthly R1 pivot at 15410 is one of the most obvious ones - for this scenario e.g. BEAR DAX X3 VNT2 could work well.
Bull & Bear Certificates
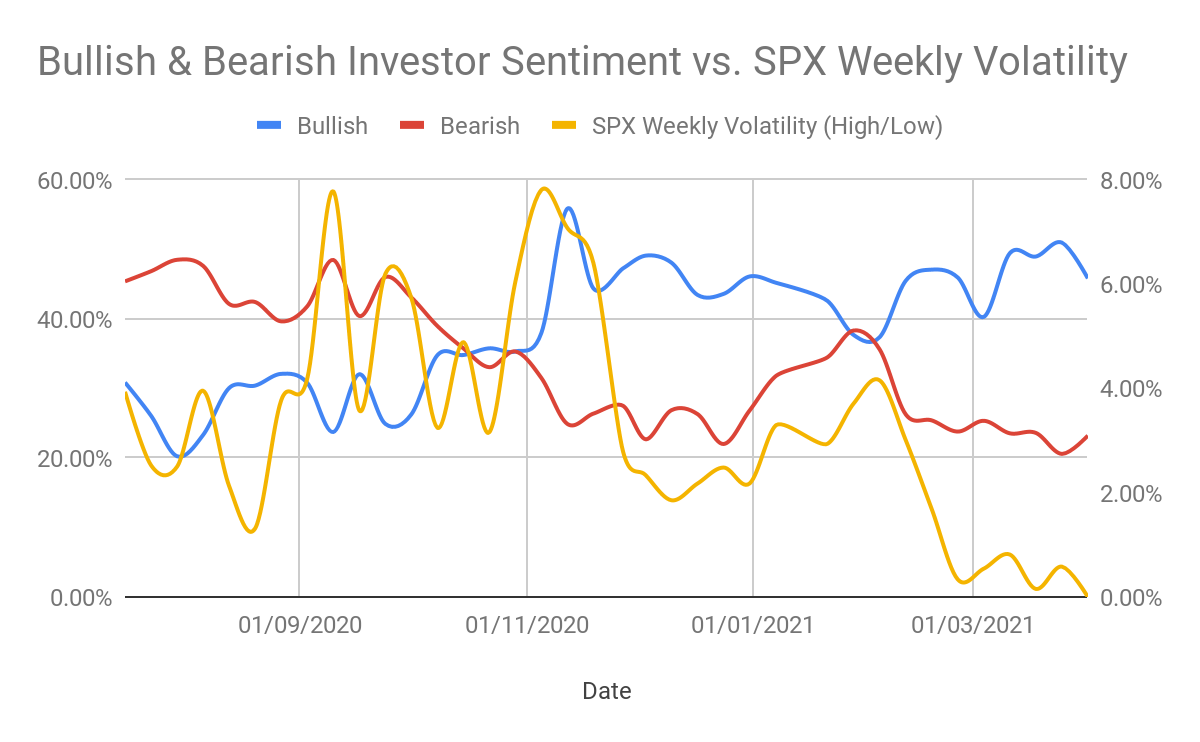
Investors’ sentiment in US has continued to be bullish, volatility continues to trend down which supports bullish view.

Above: Historically speaking, April is a very strong month for DAX

Above: McClellan indicates clearly bullish momentum with room to still go up.

Above: Split of shares in DAX index between their respective DMA20 averages. This view is also bullish.

Above: All indicators are in Strong Buy. Message is loud and clear. This strong indication often starts to work as contra indicator, likelihood for pullbacks grows.


Above: Historical weekly and daily changes for DAX.

Summary of world’s major futures: Also here the message is loud and clear.
Risks
This information is neither an investment advice nor an investment or investment strategy recommendation, but advertisement. The complete information on the securities, in particular the structure and risks associated with an investment, are described in the base prospectus, together with any supplements, as well as the final terms. It is recommended that potential investors read these documents before making any investment decision. The documents and the key information document are published on the website of the issuer, Vontobel Financial Products GmbH, Bockenheimer Landstrasse 24, 60323 Frankfurt am Main, Germany, on prospectus.vontobel.com and are available from the issuer free of charge. The approval of the prospectus should not be understood as an endorsement of the securities. The securities are products that are not simple and may be difficult to understand. Past performance is not a reliable indicator of future performance.