The Fed will open the taps for another five years


In fact, Fed Chairman Jerome Powell said nothing new during Thursday´s speech at Jackson Hole. The economic outlook is expected to be weak and Fed is prepared to support the economy. The only thing is that the Fed should not strive for 2 percent inflation but also allow periods of low inflation, followed by periods of higher than 2 percent inflation. This was good for the market since investors interpreted this as the Fed’s support will continue even if inflation picks up.
In fact, Fed Chairman Jerome Powell said nothing new during Thursday´s speech at Jackson Hole. The economic outlook is expected to be weak and Fed is prepared to support the economy. The only thing is that the Fed should not strive for 2 percent inflation but also allow periods of low inflation, followed by periods of higher than 2 percent inflation. This was good for the market since investors interpreted this as the Fed’s support will continue even if inflation picks up.

Note how inflation imploded during the crash of 2008. If you exclude Food and Energy, however, it remained relatively constant below 2 percent. This has been the Fed´s problem- no matter how generous monetary policy has been, inflation has faced a hard time reaching 2 percent.
(A side note: The definition of inflation is one of the most controversial and it is evident that central banks choose inflation measures according to what suits them. If you want to show higher inflation, it is simple- just add prices on houses and apartments or the stock market.
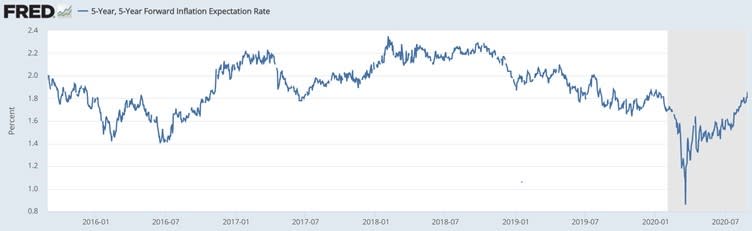
If you look at the graph above, the Fed has succeeded in its communication- inflation is expected to rise over the next five years.
The big conspiracy theory right now in the market is that central banks see inflation as the only way to write off the gigantic debts created during the recent crisis period by allowing loans to decrease in value via inflation.
It is possible that this can succeed in the United States. But the United States is not in the worst position when it come to debts, on the contrary.

EU countries have spent a lot to keep their noses above the waterline. It is difficult to understand how Italy and Spain will be able to get back on track without continued massive support. It is no wonder that the EU is currently heading for a period of increasing federalism with its own tax policy. Politicians understand that sooner or later the fixed income market would otherwise test the system by buying German bonds and selling Italian ones.

The German ten-year government bond (in orange) has developed better than its Italian counterpart (in purple) in the last six months. In the longer term, on the contrary, the Italian government bond has performed better than the German one (but no one has done well in absolute terms).

But it is not just the states that borrow money. Companies are doing the same, at an ever-increasing rate. Since the stock market is focused on market cap and not EV (where debts are taken into consideration, the stock market looks better and better.
The US-dollar weakened against the basket currencies during Friday’s trading. A continued decline in USD will result in a support for the stock market to rise in the US. As shown in the graph below, EUR/USD is trading in a neutral wedge formation. In case of a break to the upside, the formation calls for further upside with a target price around 1,22.
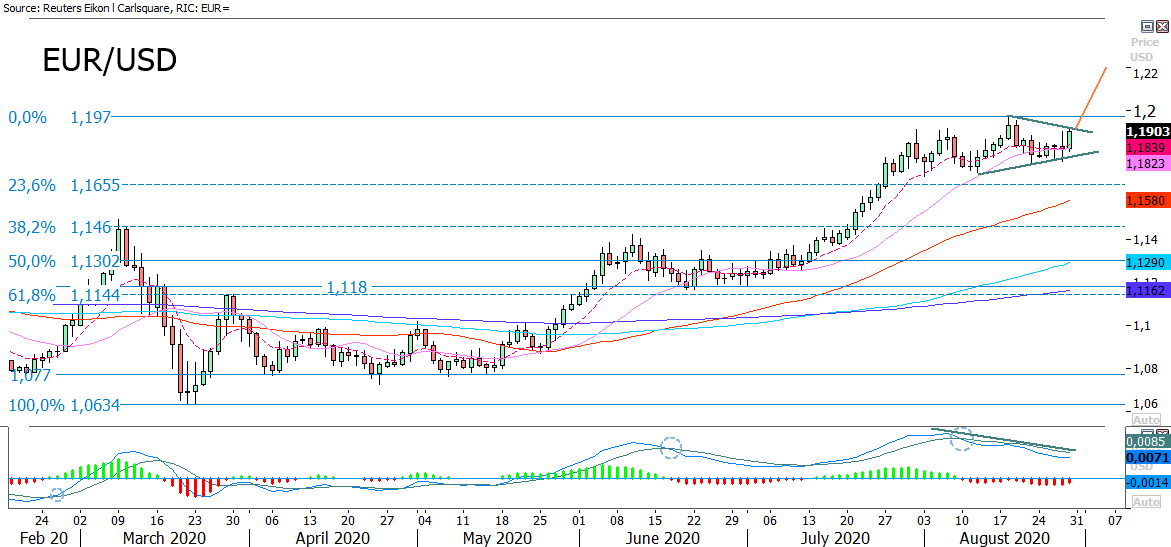
A stronger USD is likely to add weakness to the stock market in the US. Also note that MACD for the currency pair is falling. In case of a break to the downside, Fibonacci 23.6 around 1.167 serves as first support followed by MA50 around 1.158.
It is also important to keep an eye on VIX, which has now moved quickly from the lower to the upper Bollinger Band. The shrinking spread between the two Bollinger-bands indicate that a major movement may be underway.

As corporate profits decline and the stock market rises, P/E-ratios soar and are now at the same levels as in year 2000.

If you look at Warren Buffett´s favorite indicator the total stock market value compared to GDP, this indicator goes straight up to the ceiling when the market values of the listed companies push up at the same time as GDP falls. If Buffet were to follow his own indicator, he would sell everything right now. What emerges when you google his latest move is not this but that he sells bank shares such as JP Morgan Chase and Wells Fargo. But he has also bought stocks in Bank of America. Net, he certainly reduces exposure to banks.
Most notable, however, is that he bought shares in the gold company Barrick Gold (“ABX” in the graph below). Since Warren Buffett has been a major critic of owning gold, which has attracted attention. Among other things, he has said that buying gold is anti-American. Maybe it´s to avoid this if, instead of buying gold directly, he takes the detour by buying shares in a gold company? Regardless, the exposure is about the same, as Barrick Gold is a good proxy for gold.
Link to this Warren Buffet story:

Although starting to look as expensive as if it would it be a hallucination, making money on the stock market is a matter of timing. The graphs are the best mirror of the market, undistorted by various comments from analysts. To time the market, one must look at the graphs, whether they show historical prices or historical values. Suddenly a new trend emerges and then you should act.
As we have written countless times before, there are a few shares that drives the market. Those include the FAANG-companies and Microsoft that hold large index-weights.

The Netflix share is lagging its fellow FAANG-members. But as can be seen in the graph below, the share is consolidating in what can be viewed as a bullish flag-formation. A break to the upside and the formation calls for a new all-time-high:

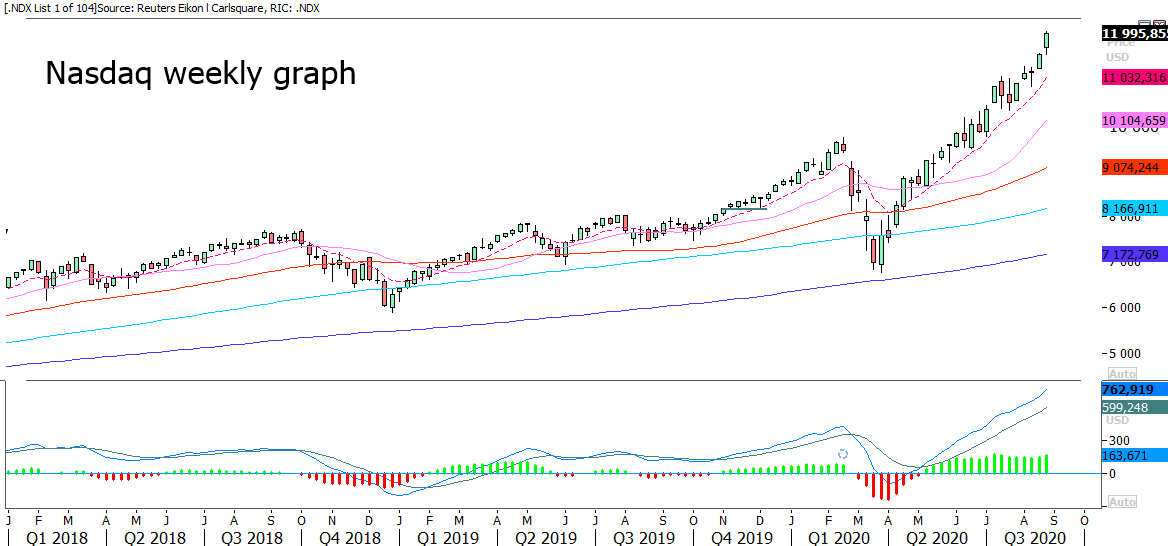
The tech-heavy Nasdaq index is following the upward trend line. Note that the graph indicates that Nasdaq is overbought but there are no sell-signals. The MA lines are rising nicely upwards, which means that a decline will probably be small and bought by the market.

The weekly graph shows the historical rise and the only thing that is comparable is the rise around the years 2000.
After taking the old top, the S&P500 index is trotting on and reached the psychologically important 3 500-level on Friday. Just as for Nasdaq, there are no sell-signals and the MA lines indicate that a decline is likely to be small and primarily seen as buying opportunities in the market.

During the last three months, S&P 500 has gained close to 16 percent, followed by the German DAX that is up close to 11 percent and China’s HSI that has increased by close to 10 percent. Sweden’s OMXS30 is up just somewhat more than 7 percent during the last three months.

The German DAX index is having difficulties to break through the gap serving as a resistance around 13 200. As earlier mentioned, it is mostly the American indices that gain from a weaker USD. Note that the index is trading above a slightly rising EMA9 and MA20 and that the falling trend in MACD has been broken. In case of a break above 13 200, the next level can be found around 13 550:

OMXS30 is also trading above a slightly rising EMA9 and MA20. However, the index has failed to break the 1 800-level several times. In case of a break below the 1 770-level and MA20, MA50 around 1 740 serves as a first level of support. In case of a break above 1 800, the ceiling of the rising wedge serves as a resistance:

Another asset gaining from a weak USD is gold. The metal is consolidating in a neutral wedge formation. Note that MACD is falling indicating that the risk can be found on the downside (from a technical perspective). In case of a break to the downside, the formation calls for a setback to Fibonacci 61.8. In case of a break to the upside, the potential is as great:

Risici
This information is in the sole responsibility of the guest author and does not necessarily represent the opinion of Bank Vontobel Europe AG or any other company of the Vontobel Group. The further development of the index or a company as well as its share price depends on a large number of company-, group- and sector-specific as well as economic factors. When forming his investment decision, each investor must take into account the risk of price losses. Please note that investing in these products will not generate ongoing income.
The products are not capital protected, in the worst case a total loss of the invested capital is possible. In the event of insolvency of the issuer and the guarantor, the investor bears the risk of a total loss of his investment. In any case, investors should note that past performance and / or analysts' opinions are no adequate indicator of future performance. The performance of the underlyings depends on a variety of economic, entrepreneurial and political factors that should be taken into account in the formation of a market expectation.