The biggest decoupling ever?


As the Corona virus spreads and China shuts down its economy, stock prices are still rising. It may be the largest decoupling ever, that is, the divergence between economic development in terms of GDP including corporate profits on one side and stock market developments on the other.
As the Corona virus spreads and China shuts down its economy, stock prices are still rising. It may be the largest decoupling ever, that is, the divergence between economic development in terms of GDP including corporate profits on one side and stock market developments on the other. The divergence between copper, being a good indicator for industrial activity, and the S&P 500 index is visualizing this decoupling very well:

There is no data on how quickly quarantines in China have hit the economy, but below is an estimate of coal demand for China's power stations. Note the seasonal decline, which however, did not increase this year, unlike previous years:

A positive note is how the Corona virus is losing momentum in China:

But the trend of the spreading of the virus outside of China is less encouraging:

Back to the stock market: Clearly, central banks are pumping liquidity into the system right now. In the US, Trump is pondering how to get re-elected. One of the proposals to keep the mood up was released as a test balloon last Friday:

The proposal aims to avoid taxation of profits from equity transactions. The idea is not stupid, but very similar to the Swedish system, which is one of the reasons why Sweden has received one of the world's highest number of listed companies per capita and a well-functioning stock market even for minor companies. The proposal could be part of a new stimulus package from the White House, whose purpose is clearly aimed at making President Trump appear as a corporate friend, unlike the "socialist democrats".

The picture above shows schematically from where energy in the stock market has come. It has been driven in turn by direct support from the central banks (preferably the Fed but also from the ECB, the Bank of China, the Bank of Japan and the Bank of England). However it was very clear that TRUMP's tax reforms drove the stock market to a new level. The first wave was driven by expectations of a tax reform. Then a new wave was driven by the increased profits of companies in the United States. What we can now possibly see is a wave when the stock market is going to subscribe to the possibility of small savers being enticed into the market as well, on the advice of President Trump. This is like the listing of Swedish Telia's share in year 2000, though raised to two.
Negative divergence can halt the party
During last week, S&P 500 managed to establish itself above its previous top that was set the week before. Momentum is still strong and there seems to be little that can stop this fast train.

As can be seen in the graph above, a rising EMA9 is supporting the upward trend. However, a warning signal can be found in the one-hour graph. This in the form of a negative divergence between the index and MACD:

Should a break to the downside occur, support can be found around the 3 338-level.
Nasdaq seem to be running on jet fuel with a bottomless tank. This bottomless tank is illustrated by the RSI, which has been on overbought levels for quite some time now:

In the daily graph below, EMA9 is supporting the rising trend from below. A break to the downside and MA20 as well as the 9 272-level would make up support:

As for S&P 500 a warning signal can be found in the hourly graph. This again in form of a negative divergence between the index and MACD:

Bull & Bear-certifikater
An acquisition made by Atlas Copco drove OMXS30 to new highs during the past week. EMA9 is supporting the rising trend. RSI is at overbought levels. In case of a break to the downside, the next level can be found around 1 834:

A negative divergence between OMXS30 and MACD is once again found in the hourly graph:

After lagging other indices like S&P 500 and OMXS30, the German DAX managed to break above the previous top during last week:

It’s starting to look like a struck record but in the one-hour graph for DAX, a negative divergence between the index and MACD can be found.

These negative divergencies serve as warning signals but the difficult part is always to get the timing right.
Increasing copper prices indicate that the worries for the economic effects from the spreading of the Corona virus has subsided:

The upwards movement in copper supports the stock market. But as can be seen in the graph above, the copper price is now facing resistance in form of a falling MA20. This level needs to be broken for the short trend to be considered a rising one.
Acquisition take Atlas Copco to new levels
Swedish Atlas Copco is aiming to acquire German Isra Vision active within quality inspection of surfaces and 3D vision systems for industrial automation. The Atlas Copco share gained ground on the news:

As shown in the daily graph above, the share also managed to close the week above EMA9, MA20 as well as MA50. Note also MACD that is close to generate a buy signal. In other words, from a technical point of view, the outlook for a test of the SEK 387-level looks promising.
Bull & Bear-certifikater
Facebook on the rise despite new investigations
The Federal Trade Commission announced last week that Facebook among other tech giants will be investigated for any form of violation of antitrust laws when executing past mergers. The share quickly covered the initial losses from the news and is now approaching MA20. A break above and the previous top from January might be tested:
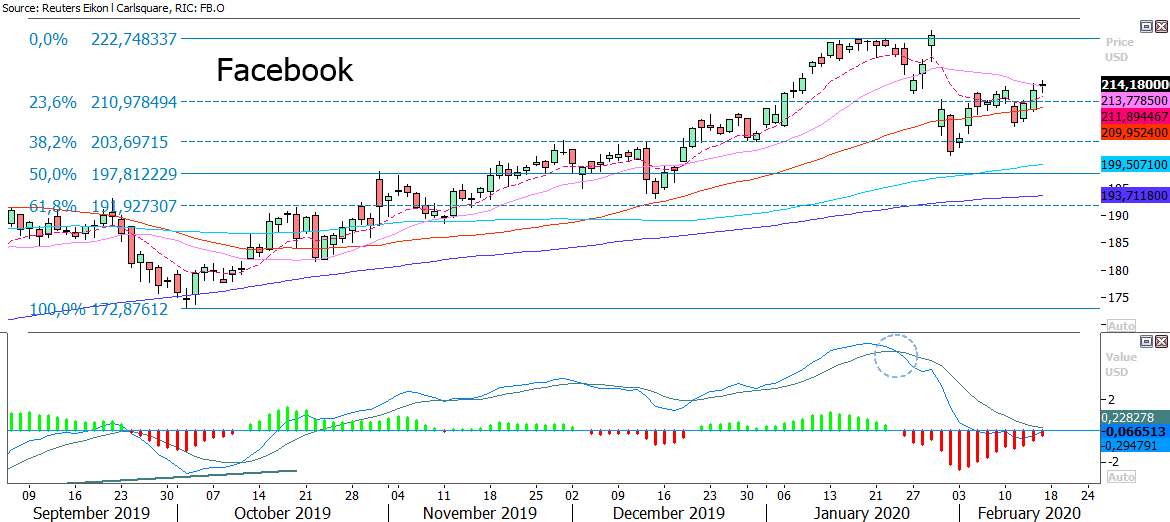
On the downside, the first support can be found around the USD 211-level.
Opportunity to buy the dip in bitcoin
Bitcoin is trading in a rising trend but fell over four percent on Friday´s trading. MA20 as well as the rising trend line and Fib 23.6 is meeting up from below as support. Perhaps this opens opportunities to buy the dip betting on the rising trend to continue.

A break below Fib 23.6 and the rising trendline calls for further downside to Fib 38.2. At this level MA200 can also be found.
Risici
This information is in the sole responsibility of the guest author and does not necessarily represent the opinion of Bank Vontobel Europe AG or any other company of the Vontobel Group. The further development of the index or a company as well as its share price depends on a large number of company-, group- and sector-specific as well as economic factors. When forming his investment decision, each investor must take into account the risk of price losses. Please note that investing in these products will not generate ongoing income.
The products are not capital protected, in the worst case a total loss of the invested capital is possible. In the event of insolvency of the issuer and the guarantor, the investor bears the risk of a total loss of his investment. In any case, investors should note that past performance and / or analysts' opinions are no adequate indicator of future performance. The performance of the underlyings depends on a variety of economic, entrepreneurial and political factors that should be taken into account in the formation of a market expectation.