Strong Q3 2020, but increased uncertainty ahead


The S&P 500 index rose by 1.6 percent last week until Wednesday, and then fell back to baseline just in time for the weekend. A little ominous was that the set back on the New York Stock Exchange came after strong Q3 reports from US banks had just been confirmed. Concern about the increased proliferation of Covid-19 and that the US Congress probably will not agree on a stimulus package before the presidential election also contributed to the decline late last week.
The S&P 500 index rose by 1.6 percent last week until Wednesday, and then fell back to baseline just in time for the weekend. A little ominous was that the set back on the New York Stock Exchange came after strong Q3 reports from US banks had just been confirmed. Concern about the increased proliferation of Covid-19 and that the US Congress probably will not agree on a stimulus package before the presidential election also contributed to the decline late last week.
If we start with the US presidential election, Biden still hold a seemingly solid lead ahead of Trump with about 4.5 percent in the six crucial Swing states (Florida, Pennsylvania and four other). These swing states in total have 101 of 538 electoral votes. For Trump it is a must to win almost all of them, since Biden has 216 secure electoral votes (i.e. California and New York) against only 125 for Trump. But the number of Trump voters may be underestimated, as his voters tend to refuse to participate in opinion polls to a greater extent than they how sympathize with Biden.

If you should trust the opinion polls the Democrats are also predicted to receive a majority in the US Senate with 51 mandates against 49 for the Republicans. If this scenario should materialize, this would give the Democrats a mandate to govern the United States for the next two years. But as we have ascertained, investors expect large stimulus packages no matter who is elected president.
But there are growing concerns how the US economy will proceed following the strong Q3 2020 macro data. One indication is that US jobless claims has been higher than anticipated for the last weeks. The last week´s figures were also probably underestimated, since the state of California (with a good 15 percent of US total GDP) has frozen its reporting for two weeks now.

As can be seen in the graph above, the decline for Initial Jobless Claims lost momentum since early August. The trend since then has been that the number of new applications for unemployment benefits have levelled off. Higher initial jobless claims are believed to increase the US household´s saving ratio, thereby decreasing private consumption, out of which the US economy has a large dependance. Bears argue that the 1.9 percent rise in US retail sales in September might be followed by weaker figures in Q4 2020. There will be more focus on macro data from this week, such as US building permits and housing starts.

If we proceed to the VIX index, which should mirror uncertainty in the stock markets, it has come down a bit so far during October. But as we know there are topics that could give new outbreaks later this year.
When it comes to Brexit the chances of striking a deal seem to have decreased further. The reason is that the EU is not willing to improve their stance more than they already have done. Trade issues between the world´s fifth largest economy (the UK) and the Eurozone which combined is almost the same size as China (second after the US) is certainly of interest for the stock markets. Most importantly the United Kingdom is a net importer of significant amounts of goods and services from countries in predominately in the European Union.
The Q3 reporting season
Following the large US bank reports last week, just under ten percent of the S&P 500 companies (49 out of 504) had reported their Q3 figures up to and including October 16. Of these reports, 86 percent were better than expected at the profit level, while 82 percent surprised positively at the revenue line. Companies in three sectors are at 100 percent better profits than expected; Energy, Non-cyclical consumer goods and health care, where however only non-cyclical consumer goods have enough reports (7) to be a little more statistic reliable. The financial sector, where many large companies reported last week, is 88 percent better than anticipated in terms of profit, much like the S&P 500 index in general.
On the revenue side, 82 percent of the reports are better than expected (i.e. in USD, which was some five percent weaker during Q3 2020 against, for example, the Euro). But the currency does not play as a big role for the revenue line for the average S&P 500 company, which sells about 65 percent of its products in North America. In that case, it is more interesting that it is industry (engineering) that has the worst outcome on the revenue side, only 56 percent higher than expected.

The S&P 500-index is struggling to reach new highs. As the index is trading above rising MA20, the trend can be considered as positive. But given the uncertainty on any stimulus package and the election that is coming up in addition to the increased spreading of Covid-19, a break to the upside may be off for further in the future. Se graph below:

Notably, the Nasdaq 100-index is trading in a similar way as S&P 500, struggling to reach the previous top. Se graph below. But the reporting season is far from over and the heavy-weights like the FAANG-members are yet to come.

In Sweden, Volvo reported already on Friday 16 October (four days earlier than anticipated) and beat analyst´s earnings expectations by 24 percent. Even more surprising was that the order intake for trucks was 51 percent more than analyst´s expectations according to Infront. Order intake for trucks increased relative most in North and South America. However, the Volvo Group´s sales were 16 percent lower and profit after net financial items 25 percent worse in Q3 2020 compared to Q3 2019.
Volvo has also outperformed OMXS30 and is currently trading close to its all-time-high in a rising trend. The question is if the share has gotten enough momentum to break up, or if the share needs to gather new energy during a phase of consolidation. Support on the downside is made up by MA20 as well as MA50 and the second rising trendline. Se graph below:

On the other hand, Sandvik´s Q3 2020 results fell slightly short of analysts’ expectations both in terms of sales and order intake. If we study the order intake by business area, it was quite good on the Mining and Rock Technology side with plus 2 percent calculated on price and volume (however not currency effects that contributed minus 10 percent). It looks weaker on the tool/industry side (Machining Solutions) where order intake was down by 19 percent during Q3 2020 on price/volume and minus 24 percent including structure and currency effects. The Sandvik Group´s profit after net financial items was 30 percent lower in Q3 2020 compared with Q3 2019.
Also, the Sandvik share does not look as strong as Volvo. As can be seen in the graph below, Sandvik is trading in a descending triangle. In this case, when the share is coming from an upwards sloping trend, the descending triangle tend to break on the downside. But the floor of the triangle is strengthened by MA200 hoovering at about the same level:

OMXS30 index rose on Friday and was lifted by Volvo. The index is still lagging the S&P 500 and need to break up above the 1 850-level before it can test its pre-Corona level just above 1 900:

In Germany, the DAX index also saw some gains on Friday as the index bounced of a rising MA100. The shorter moving averages are trading sideways, and the Index is likely to need a trigger to be able to close the gap before testing previous high:

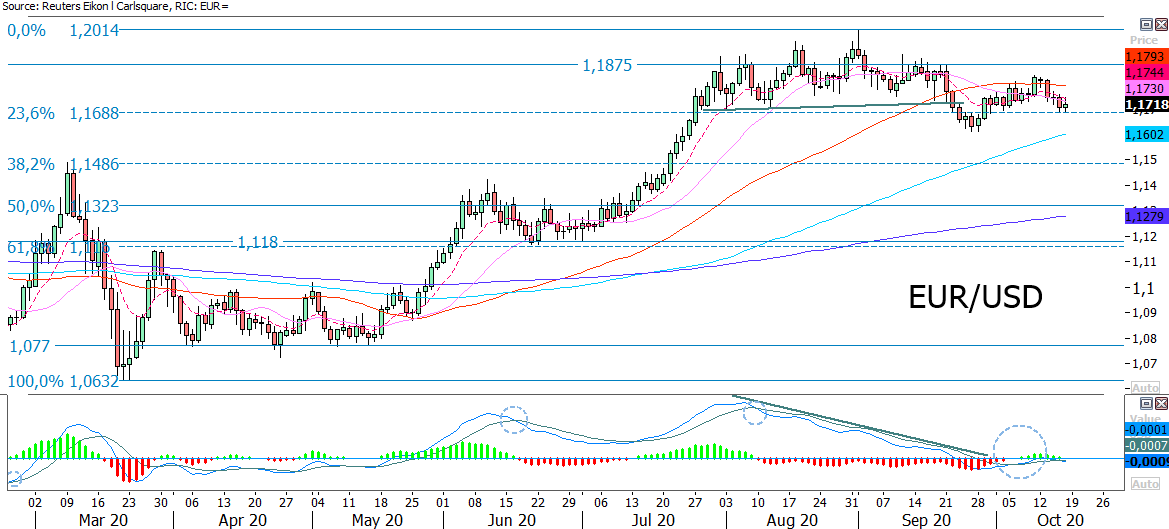
The EUR/USD is under pressure, pushed downwards by EMA9 as well as MA20 trading close to support around 1,169 where Fibonacci 23.6 meet up. The next level on the downside is made up by MA100 at 1.16:
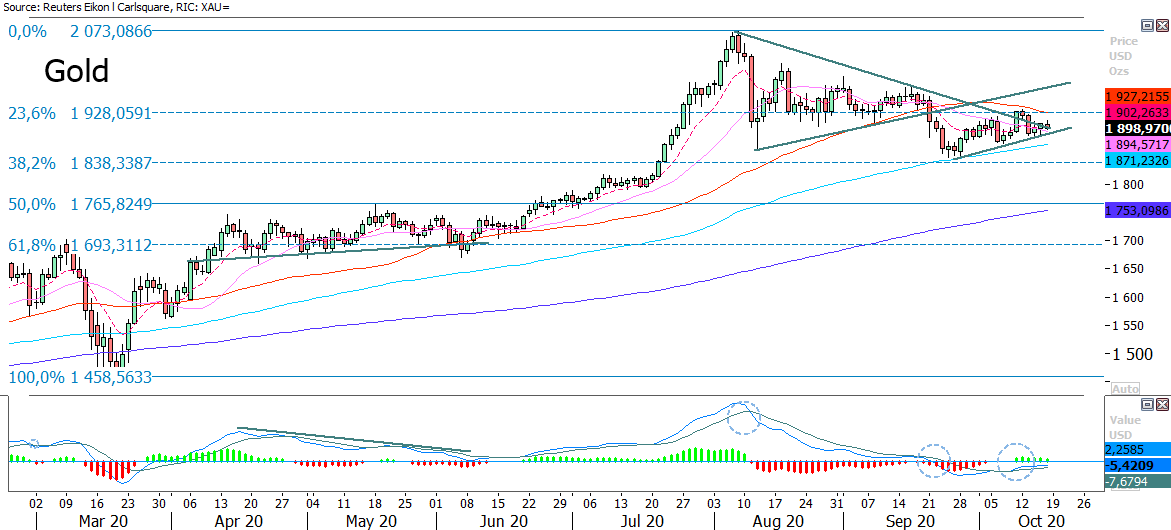
All else equal, the gold price is punished by a stronger USD. Gold is trading close to a rising MA100 supporting the metal from underneath. The next level on the downside can be found around 1 838 USD per troy ounce, where Fibonacci 38.2 meet up:
Bicoin is consolidating after a nice upwards swing. MACD has generated a buy-signal and the currency is trading above a rising EMA9 and MA20. A continued upward movent towards 11 924-12 035 would not be surprising:

Risici
This information is in the sole responsibility of the guest author and does not necessarily represent the opinion of Bank Vontobel Europe AG or any other company of the Vontobel Group. The further development of the index or a company as well as its share price depends on a large number of company-, group- and sector-specific as well as economic factors. When forming his investment decision, each investor must take into account the risk of price losses. Please note that investing in these products will not generate ongoing income.
The products are not capital protected, in the worst case a total loss of the invested capital is possible. In the event of insolvency of the issuer and the guarantor, the investor bears the risk of a total loss of his investment. In any case, investors should note that past performance and / or analysts' opinions are no adequate indicator of future performance. The performance of the underlyings depends on a variety of economic, entrepreneurial and political factors that should be taken into account in the formation of a market expectation.