Gold should be attractive in a Bear market


Last week, there was a recovery in the European stock markets and even more in the U.S., with Nasdaq as the best performer. The war in Ukraine continues with all its cruelties. However, it seems to be more encapsulated. Signs of the war approaching a stalemate phase are that Russian soldiers have started digging trenches and laying out mines north of Kyiv.
Last week, there was a recovery in the European stock markets and even more in the U.S., with Nasdaq as the best performer. The war in Ukraine continues with all its cruelties. However, it seems to be more encapsulated. Signs of the war approaching a stalemate phase are that Russian soldiers have started digging trenches and laying out mines north of Kyiv.
European stock markets should favor most out of this scenario in relative terms. However, we still witness a conflict with long-term adverse effects on world trade and supply on crucial commodities. It is probably too early to start more broadly buying into the stock market.
Significant stock indices performance on Friday, March 21, 2022, in one week and this year

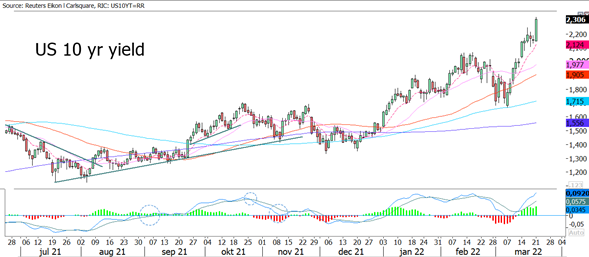
So far this year, the 10-year U.S. government bond yield have risen from 1.51% to 2.30%. The interest rate increased by 0.15% to 2.30% on Monday, March 21, following a speech by the Fed Chairman, Mr. Powell. No one can deny that inflation is too high anymore. If we add a 2.5% risk premium to the 10-year risk-free yield, the interest rate hike justifies a 16% decline in U.S. stock markets this year (measured in the justified change in p/e-ratio). The price fall has been less than that, about 7% down in the S&P500 and 12% in the Nasdaq.
U.S. 10-year Treasury Yield from June 28, 2021, to March 21, 2022
The five-year chart shows how the U.S. 10-year yield approach levels from 2018.
U.S. 10-year Treasury Yield, weekly five-year chart

Gold price may recover
The price of gold fell back last week, as did the oil price. While oil has rebounded upwards (as we suspected), the gold price has consolidated at a lower level. Our thesis is that it is too early to buy equity markets broadly. Furthermore, today's high inflation and ongoing Ukraine war should benefit the gold price development.
Gold price (in USD) from September 20, 2021, to March 21, 2022

The five-year chart shows that the gold price may have to go down to the USD 1850-1870 per ounce range before turning up from the bottom of a rising secondary trend channel.
Gold price (in USD) weekly five-year chart

The full name for abbreviations used in the previous text:
EMA 9: 9-day exponential moving average
Fibonacci: There are several Fibonacci lines used in technical analysis. Fibonacci numbers are a sequence of numbers in which each successive number is the sum of the two previous numbers.
MA20: 20-day moving average
MA100: 100-day moving average
MA200: 200-day moving average
MACD: Moving average convergence divergence
Risici
This information is neither an investment advice nor an investment or investment strategy recommendation, but advertisement. The complete information on the trading products (securities) mentioned herein, in particular the structure and risks associated with an investment, are described in the base prospectus, together with any supplements, as well as the final terms. The base prospectus and final terms constitute the solely binding sales documents for the securities and are available under the product links. It is recommended that potential investors read these documents before making any investment decision. The documents and the key information document are published on the website of the issuer, Vontobel Financial Products GmbH, Bockenheimer Landstrasse 24, 60323 Frankfurt am Main, Germany, on prospectus.vontobel.com and are available from the issuer free of charge. The approval of the prospectus should not be understood as an endorsement of the securities. The securities are products that are not simple and may be difficult to understand. This information includes or relates to figures of past performance. Past performance is not a reliable indicator of future result.