Can President Trump deflate the USD to save the election?

In the two last weeks, the historically strong stock market rise that has been going on since March has been seriously challenged. As usual, people are looking for reasons and rationality. The answer is that they rarely exist.
In the two last weeks, the historically strong stock market rise that has been going on since March has been seriously challenged. As usual, people are looking for reasons and rationality. The answer is that they rarely exist.
One way to describe this is to suddenly fold the total weight of arguments for selling, over the total weight for reasons to buy. Somewhere In this ocean of arguments and theories, news agencies and the average analyst are trying to navigate. The only way to handle the rise will be to raise the justified valuation figures and, in this case, deduct Covid-19 as a seasonal adjustment.
Speaking of seasons.

In his latest podcast, Joushua M Brown reviews theories as to why the stock market usually crashes in September-October.
https://thereformedbroker.com/podcast/
At the time when the American economy was dominated by agriculture, it was quite obviously large flows of money to and from the agricultural sector. During the autumn, the farmers gradually sold of the harvest, which generated large incomes. These revenues were invested in the banks. From the banks, these flowed into the New York Stock Exchange or the Chicago Commodity Exchange. This pushed up markets that could rise. But somewhere during the summer, this money began to be gradually withdrawn. That was when all the farmers paid extra wages to everyone who worked extra in the harvest. Without any apologies, shares and commodities were sold on the markets to release liquidity.
How could one have seen these movements. Yes, it was easier at that time. There was no electronic money, but all these amounts had to be moved physically. A huge fleet of vans drove around all the coins, bank notes and gold bars to all the banks where the farmers stood in line to collect their money.
It simply forms ebb and flow in the financial system.
One of the important points in the podcast, which we also can attest to, is that it is often not possible to point out any individual event or news that creates the crashes. Not even afterwards. There are always some guys who have argued for a stock market decline that were given right, but their timing may have been lousy.
So now we are in this difficult time of the year when stock market crashes are often born. But since 1929, firstly the United States and the UK and some decades later Japan and EU have been endowed with strong central banks that possess the power, the strength and the willingness to deal with both temporary and longer liquidity shortages in the system.
Of course, this should handle seasonal variations. However, we are of the opinion that the central banks are playing far beyond what can be stated as natural today when they try to carry entire financial system under their arms.

It´s almost silly when you study the graph above and see that the stock market kindly follows the Fed´s purchase of assets in the market. Note that in recent weeks, purchases have dried up, which means a liquidity-tightening effect at this time when the economy is at a low ebb. This single graph can provide the answer why the stock market is weak for the moment.
Of course, that´s very likely, but if Fed chief Jerome Powell would like to give back for old wrongs to President Trump, this of course how he should do it. Slowly tighten the taps ahead of the presidential election to give Biden a little extra boost.
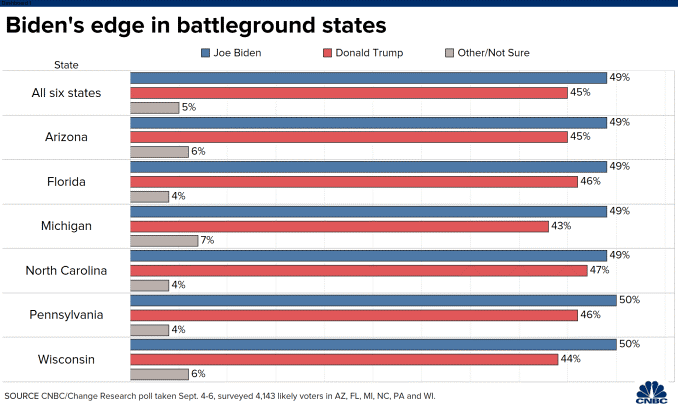
Biden has a clear advantage right now. The best Trump could do now is to strike with a reform or something else that would lift the stock market.
If you look at what the graphs look like, a lot of them balance on support levels. This means that right from here there is a potential for a sharp upward trend. In the same way, there is also room for a sharp decline if nothing happens.
The S&P500 index in the graph below has fallen below the long trend line. This has been tested from the bottom and the attempt to retrieve it has failed. Note how the index now balances on MA50, which is an important guideline also in the mainstream media in the United States. MA50 can thus also as be viewed as an important support if positive news should emerge.

The 60-minute graph below shows how a set wedge was created. Technically, this should break out on the upside. If you measure the base at an angle and place it as a symmetrical rise, however, you do not get very far. It mostly looks like a set-up for a temporary rebound in a market that is in a declining trend. But in this volatile market, you should take one day at a time.

There are a few epicenters in the market that are more important than others. The obvious thing right now is of course the Tech companies in the US, which we will go through below. Another market that we highlight from time to time is the oil market.
The WTI oil-graph below shows how the oil price is supported by MA100. In case of a break, there is further downside to the next Fibonacci level at 37.1 USD per barrel.

Just as the American farmers caused a seasonal pattern on the stock exchanges, so the oil market contributes to a corresponding pattern. The so called “driver’s season” is over in the US and it was unusually subdued this year due to Covid-19. Now we are instead in the hurricane season where the refineries on the US coast cut back on orders as they take the opportunity to do their annual service reviews. With a squeezed oil price and huge deficits in the state budget, it is said that Saudi Arabia is out with price reductions in the market to secure sales to Asia and Europe. And when oil prices fall, oil countries divest other assets.
Nasdaq 100 below has fallen below the rising trend line and is now balancing on the MA50 and Fibonacci 23,6. Note that MACD has generated a weak sell signal and that EMA9 is trending downwards. Could a new trend be in the making?!

The graph looks pretty much the same for the leading FANG companies. However, these are still above the rising trend line.

Apple below is leading. It is traded at the trend line, just above MA50 and above the lower Bollinger Band. This is where you should buy if you want to turn the market upwards. At the same time, this is where you should dump shares if you want to lower the entire stock market. What are the big trading desks doing now as everyone has returned from their vacation? Was this decline enough or should we take another turn downwards?

The Tesla stock has given two ugly candles in the graph. These indicate that even though the stock is up, buyers are loosing to sellers in intraday trading. Possibly Tesla can consolidate like the gold price (further on that below).

Now that the Tech sector is weighing in, it´s obvious that Trump must act. Either now or in October to secure the election win. The easiest way is to force the Fed to act. Alternatively, he may launch his own reform. The best goal is undoubtedly to lower the USD.

The weekly graph above shows how the USD-index is turning up from extreme oversold levels. Can EMA9 be resistance? Note that the sell-off is related to Covid 19 and that the decline has its mirror image in form of a rise in the stock market during the same period after the central banks opened their taps.
Contrary to concerns about Covid 19, presidential elections and new support from the Fed. The single most important thing is if Fed starts buying support again. The markets are extremely receptive to that type of information. Therefore, we believe that Fed Chairman Powell is under enormous pressure from the White House now to resume and perhaps increase its support. All that is needed is for President Trump to start tweeting about it.
The EUR/USD did not manage to break up back above the floor of the rising trend channel. Note also that MACD is falling.

If Trump lowers the USD, gold will be a winner. Note the consolidation after the parabolic rise followed by the mini crash in the gold price.

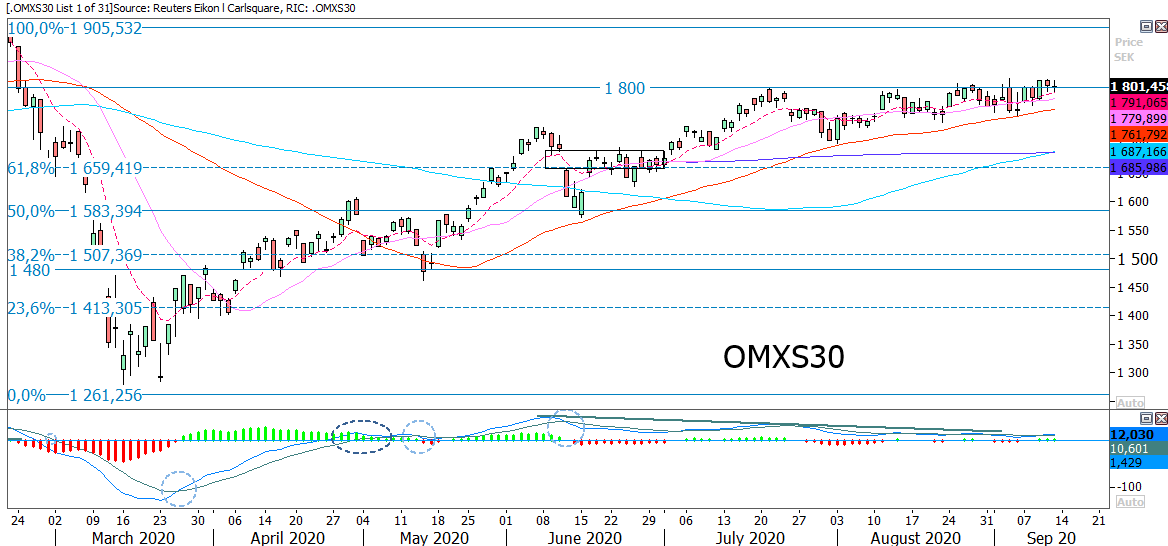
In Sweden, OMXS30 is still wrestling with the 1 800-level. A break and the way up to previous top from February looks quite free:
German DAX index is struggling to clear the gap from February:

Risici
This information is in the sole responsibility of the guest author and does not necessarily represent the opinion of Bank Vontobel Europe AG or any other company of the Vontobel Group. The further development of the index or a company as well as its share price depends on a large number of company-, group- and sector-specific as well as economic factors. When forming his investment decision, each investor must take into account the risk of price losses. Please note that investing in these products will not generate ongoing income.
The products are not capital protected, in the worst case a total loss of the invested capital is possible. In the event of insolvency of the issuer and the guarantor, the investor bears the risk of a total loss of his investment. In any case, investors should note that past performance and / or analysts' opinions are no adequate indicator of future performance. The performance of the underlyings depends on a variety of economic, entrepreneurial and political factors that should be taken into account in the formation of a market expectation.