An uptrend in clothing adds potential to H&M's share


Last week was yet another up-week for the broad stock index S&P 500 in the U.S. The positive momentum continued on Monday. At the same time, short as well as longer-dated interest rates have been coming up. However, during the two last trading days, the ten-year yield has flattened out while the two-year interest rate has continued to rise.
Last week was yet another up-week for the broad stock index S&P 500 in the U.S. The positive momentum continued on Monday. At the same time, short as well as longer-dated interest rates have been coming up. However, during the two last trading days, the ten-year yield has flattened out while the two-year interest rate has continued to rise. Given the current yield development with different duration, the inverted yield curve is getting even closer. Typically, an inverted yield curve implies an economic slowdown may be in the cards.
When we studied macro statistics from last week, the initial jobless claims figures from the U.S. do not support the thesis on a recession, at least not soon. However, some forward-looking data suggest something different. The German IFO index did not indicate the same optimism as the business climate's current and future outlook declined more than expected. So did consumer confidence in the Michigan index from the U.S. and consumer confidence in the Eurozone.
As measured by HYG (an ETF for U.S. junk bonds), risk appetite in the market remains at a low and declining level.
HYG ETF (in USD) graph from July 30, 2021, to March 28, 2022

HYG ETF (in USD) weekly five-year chart

Russian military forces now appear to withdraw from some areas north of Kyiv in the Ukraine war. Instead, the Russian military build-up increases in southern Ukraine, partly in the Donbas region and along the Black Sea coast. While this may result from a Russian military failure, it risks cutting Ukraine off from the Black Sea and its export ports. Higher food prices we have already seen. But overall, the war in Ukraine seems to be mainly discounted by the stock market.
This week's macro agenda includes two essential news items from the United States.; firstly, Q4 2021 GDP on Wednesday, March 30, and March employment figures to be released on Friday, April 1. The expected number of new jobs in the United States is 475,000, following last month's strong result of 678,000 in February.
4.6 percent yield in the H&M share
It is not illogical for investors to shift from fixed income to equities in a situation of rising interest rates. After all, some companies are less sensitive to interest rates. One such company is Hennes & Mauritz. Admittedly, the group's earnings performance has not been excellent in recent years, with lower margins. But in the financial statements for 2020/21, a turn for the better appeared. In Q4 2020/2021 (1 September-30 November), H&M improved its operating margin to 11.0 percent compared to 7.4 percent in Q4 2019/2020.
H&M shares (like Volvo) took a beating on the stock market in the wake of Russia's attack on Ukraine on February 24. Russia was H&M's sixth-largest country in revenue, accounting for 3.6% of the group's total revenue in F.Y. 2020/2021. On March 2, 2022, H&M announced that it was suspending all sales in its 168 Russian stores until further notice. Furthermore, H&M Group donates clothes and other necessities. H&M Foundation has also made donations to Save the Children and the UNHCR. But pausing is not the same as shutting down, as many other Western companies have decided to do. It opens the possibility of resuming sales again if and when sanctions against Russia eventually will be removed.
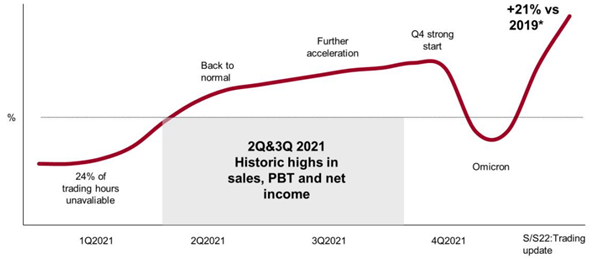
H&M group sales increased by 16% in local currencies in Q1 2021/2022 (December 1, 2021-February 28, 2022). H&M's main competitor Inditex describes its sales trend in the last five quarters in its F.Y. 2021 report.
Inditex sales development from Q1 2021 to Q4 2022 compared to 2019
Given the current depressed share price, the H&M share is trading at a P/E of 21x LTM from December 1, 2020-November 30, 2021. With a dividend of SEK 6:50 per share, the stock yields 4.6 percent. That's roughly in line with the interest on a high-interest corporate loan. Then you also buy into a world-leading company. We know that dividends do not come with Vontobel's trading instruments. You have to buy the share to receive the dividend. But we argue that today's high dividend yield requirements support H&M's share price regardless.
H&M share price (in SEK) from July 30, 2021, to March 28, 2022

H&M shares are possibly breaking up, having bottomed out around March 7 due to its exposure to Russia. It was two weeks after the outbreak of the Ukraine war and the decision to impose significant sanctions on Russia.
H&M share price (in SEK) weekly five-year chart

The full name for abbreviations used in the previous text:
EMA 9: 9-day exponential moving average
Fibonacci: There are several Fibonacci lines used in technical analysis. Fibonacci numbers are a sequence of numbers in which each successive number is the sum of the two previous numbers.
MA20: 20-day moving average
MA100: 100-day moving average
MA200: 200-day moving average
MACD: Moving average convergence divergence
Risici
This information is neither an investment advice nor an investment or investment strategy recommendation, but advertisement. The complete information on the trading products (securities) mentioned herein, in particular the structure and risks associated with an investment, are described in the base prospectus, together with any supplements, as well as the final terms. The base prospectus and final terms constitute the solely binding sales documents for the securities and are available under the product links. It is recommended that potential investors read these documents before making any investment decision. The documents and the key information document are published on the website of the issuer, Vontobel Financial Products GmbH, Bockenheimer Landstrasse 24, 60323 Frankfurt am Main, Germany, on prospectus.vontobel.com and are available from the issuer free of charge. The approval of the prospectus should not be understood as an endorsement of the securities. The securities are products that are not simple and may be difficult to understand. This information includes or relates to figures of past performance. Past performance is not a reliable indicator of future result.